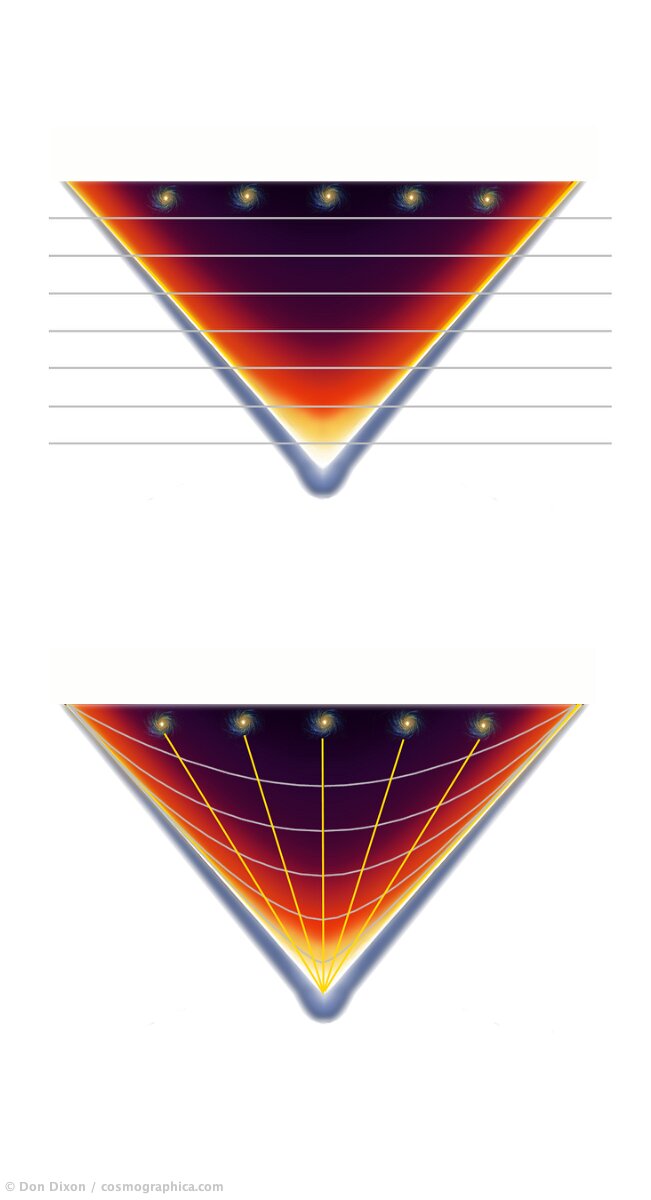
 350-time-temperature-dixon – This theoretical cosmological infographic contrasts two different geometric models of space and time expanding from a central singularity. Both diagrams present an inverted triangular light cone tracking cosmic evolution, where a pale blue border transitions into a fiery orange and dark purple interior, capped by a row of distinct spiral galaxies along the modern epoch at the top. The upper diagram overlays a grid of rigid, horizontal linear time slices, while the lower diagram maps cosmic expansion using curved, concentric coordinate lines intersected by branching yellow worldlines that trace galactic trajectories back to a unified origin point. digital illustration for Scientific American, 2002
Click to open this image within the album!
